by KISSEI COMTEC
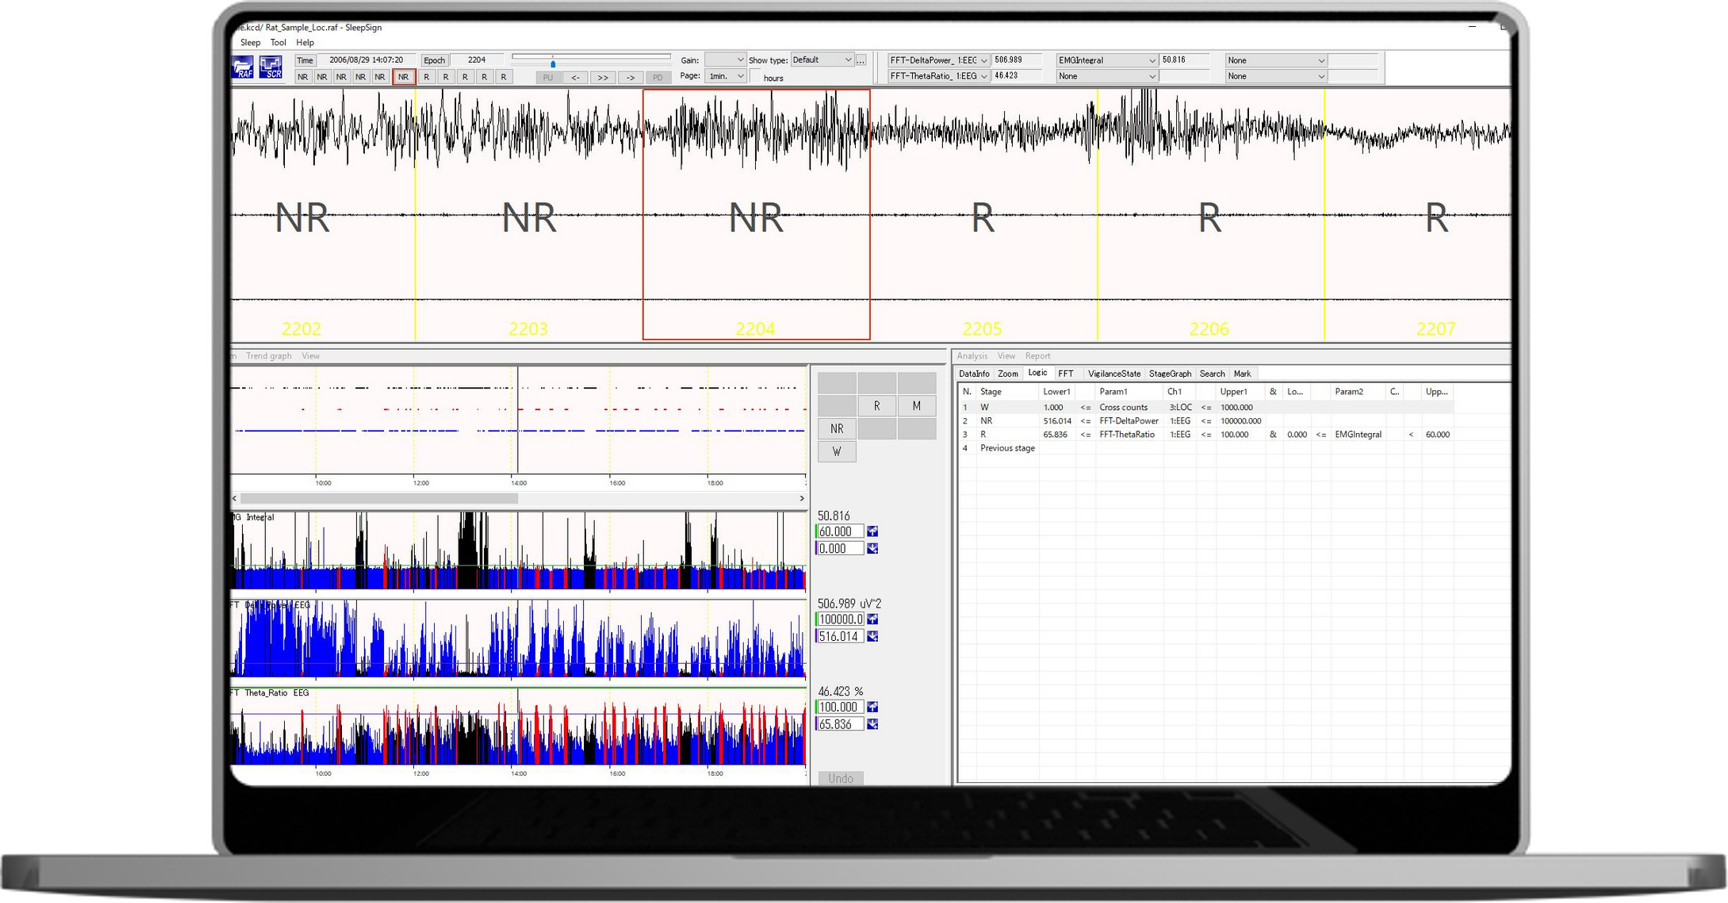
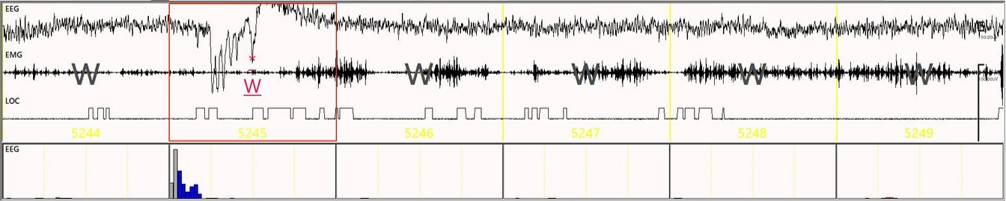
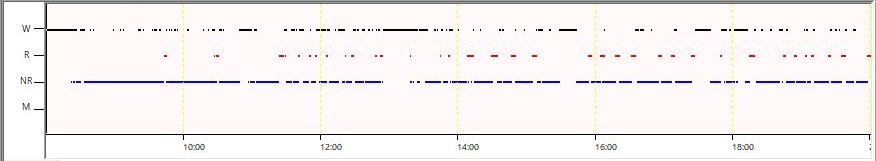
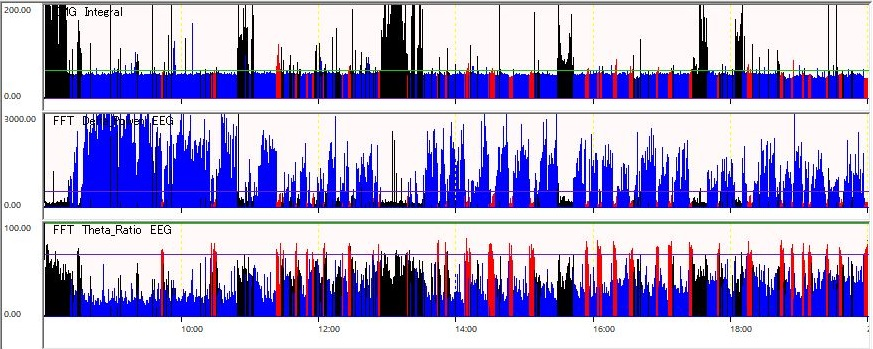
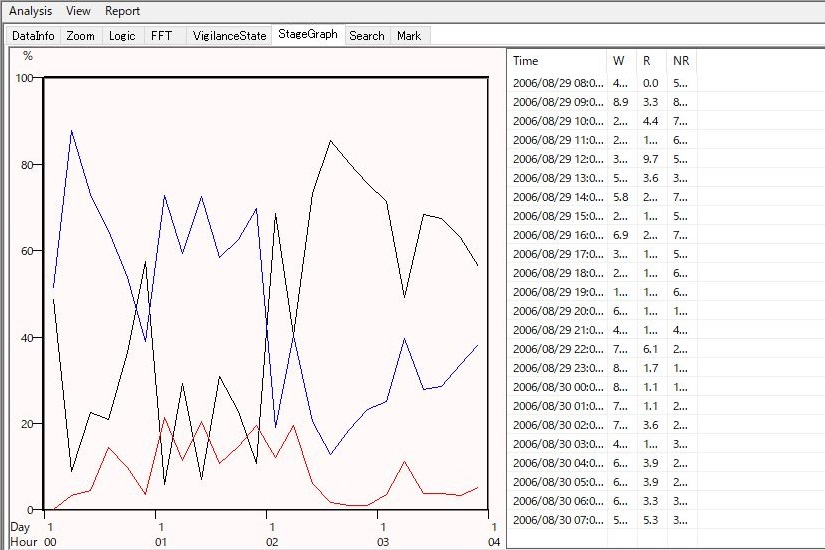
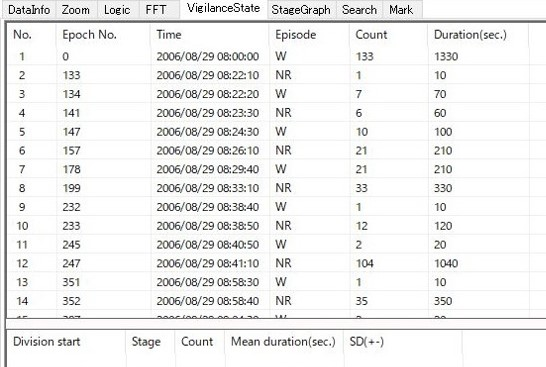
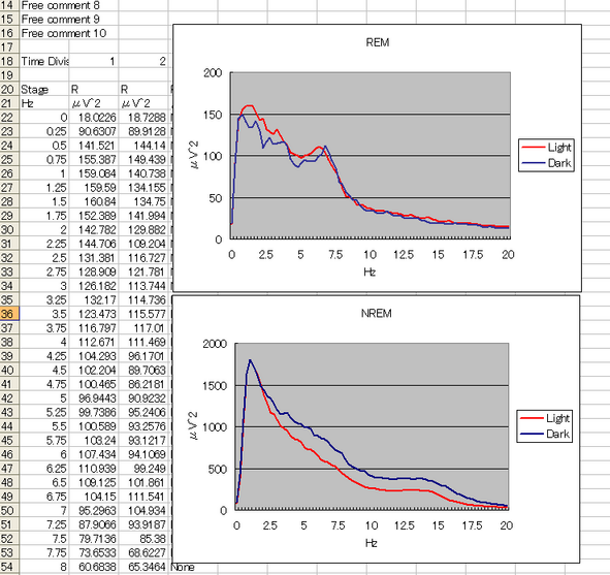
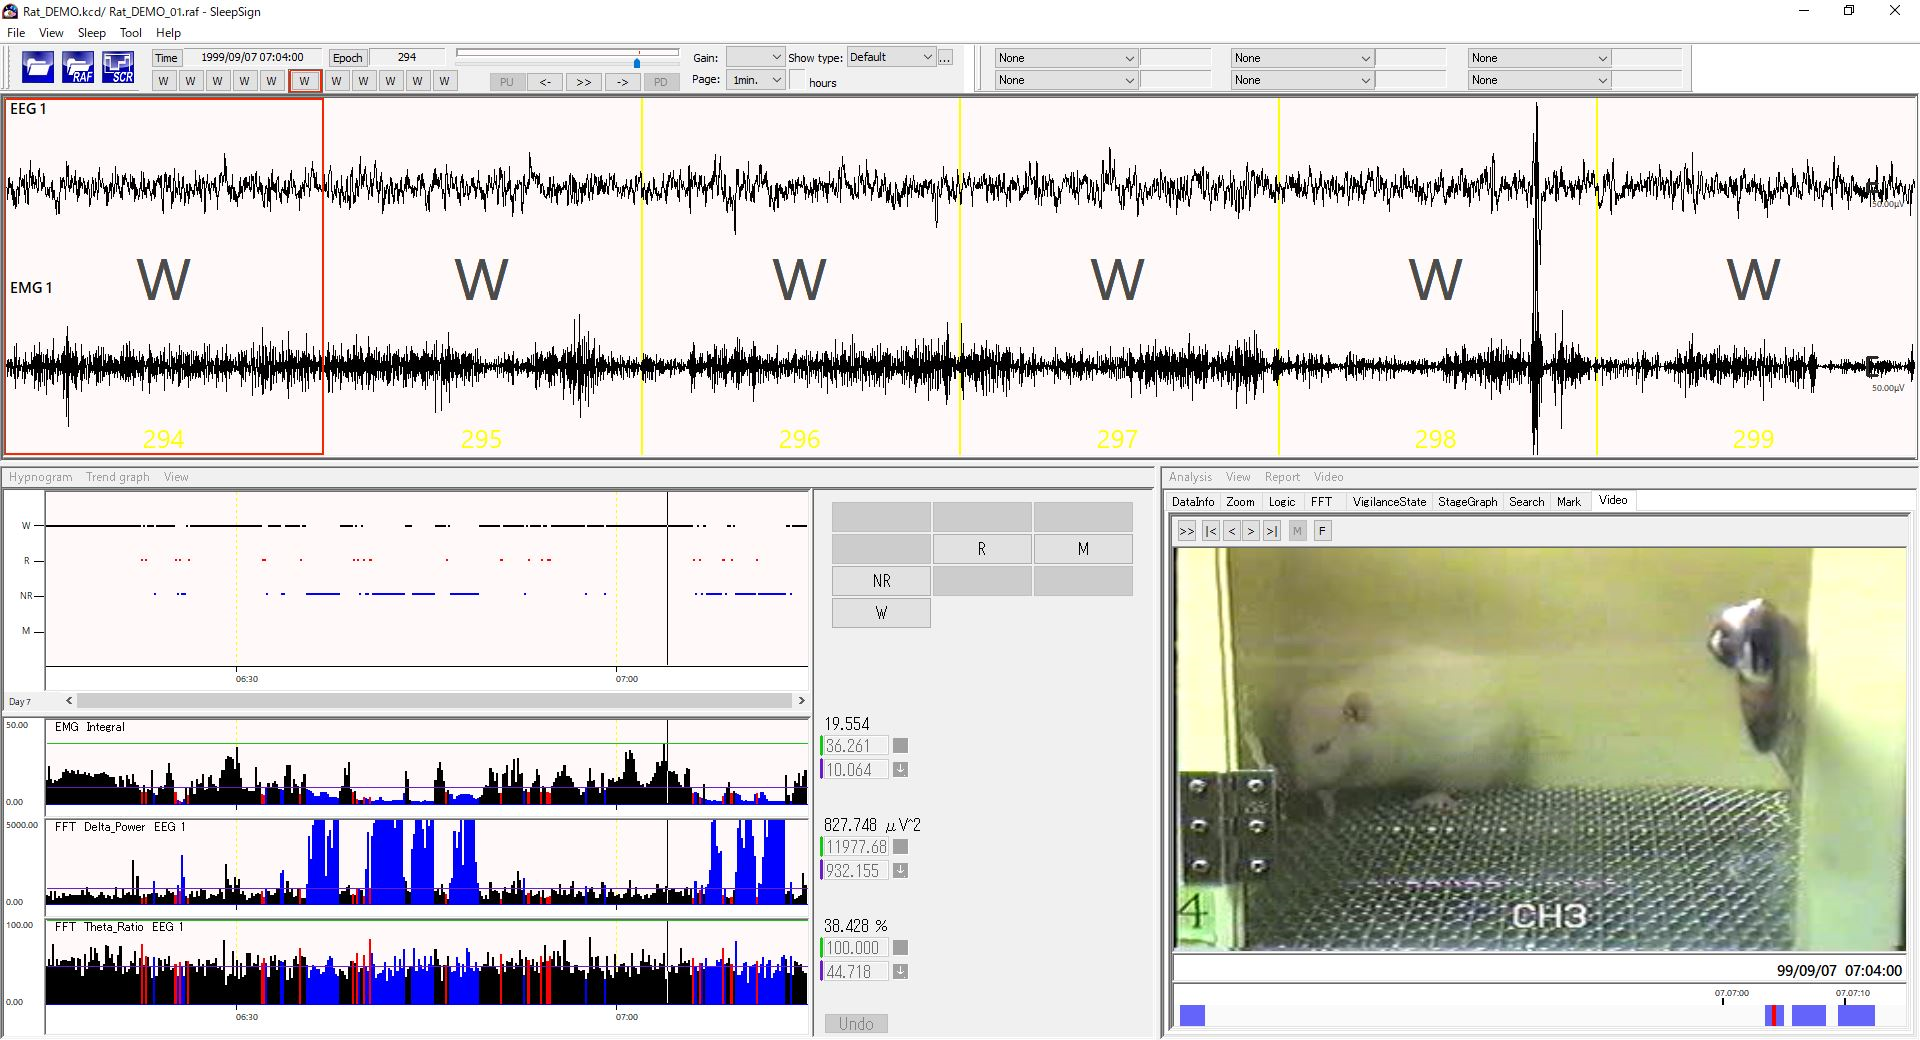
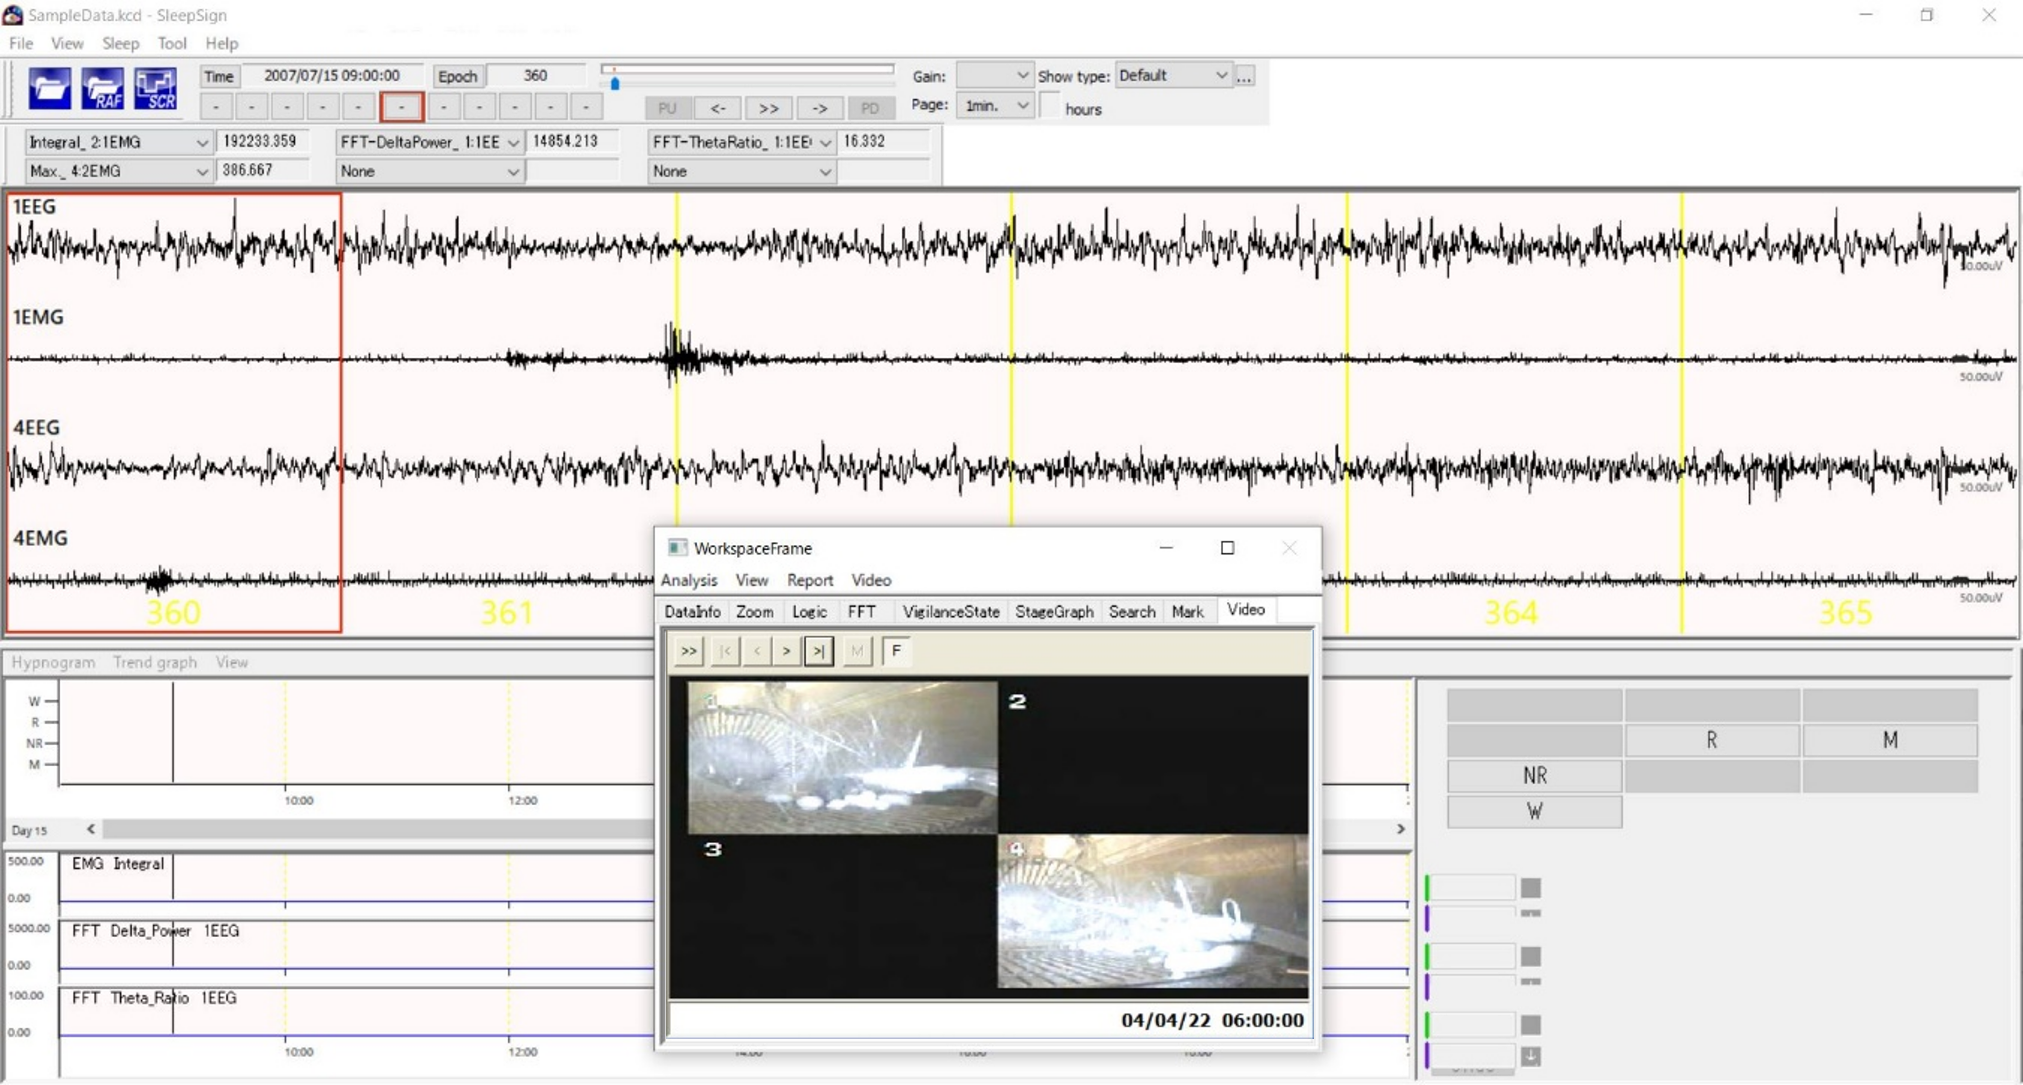
SleepSign for Animal drastically reduces the time and labor you spend on stage scoring with its Auto-Scoring function and many other useful functions to assist your manual scoring. In addition, SleepSign for Animal enables you to generate various types of reports which are required as standard in the basic sleep research field with a few key strokes. These report functions enable you to grasp sleep quality and sleep quantity very easily.
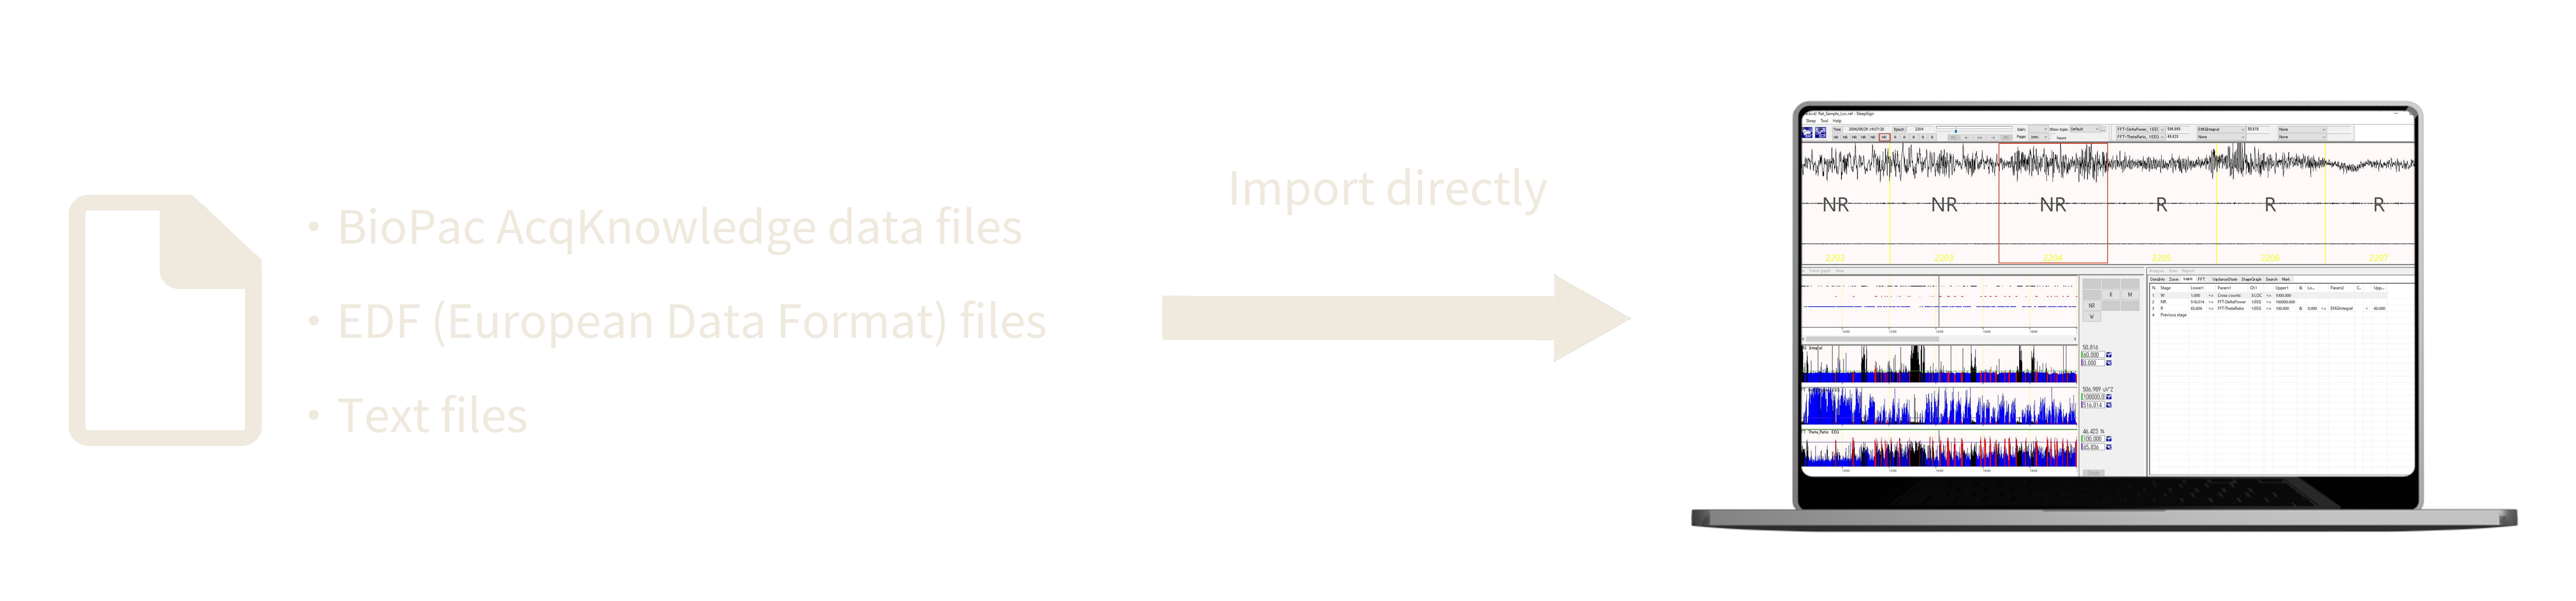
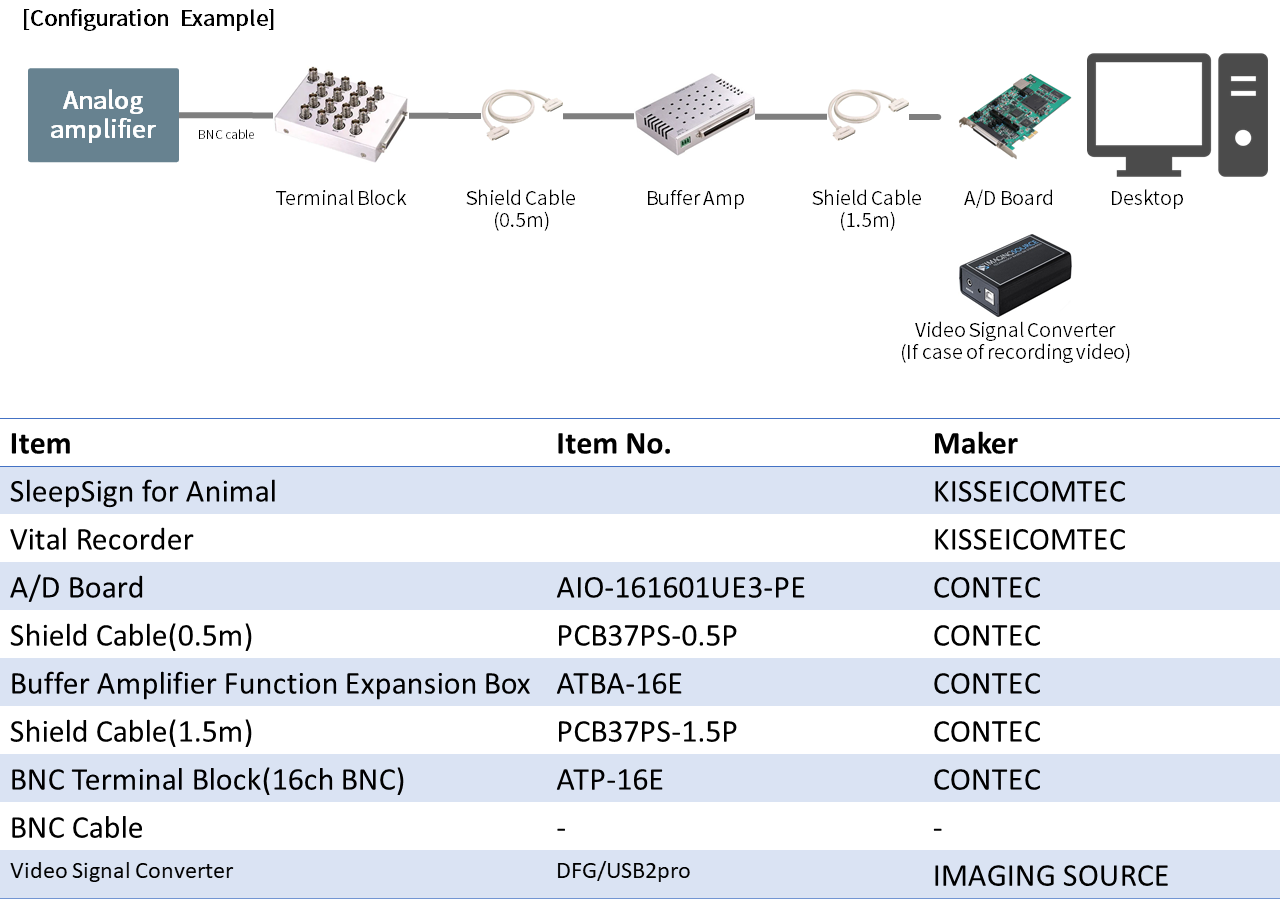
Data Analysis Data Acquisition Video Recording1 min / page display
The auto-scoring function and many useful functions to assist your manual scoring drastically reduce the labor and time you spend on sleep/wake stage scoring.
SleepSign scores sleep/wake stages automatically based on EEG and EMG. The criteria of the auto-scoring can be configured flexibly to satisfy various criteria of each researcher. Auto-Scoring results can be manually modified very easily.
Multi animal staging can be simply performed just with one step presetting. You can drastically reduces the time and labor you spend on stage scoring with its Auto-Scoring function.
Epoch length can be selected among the following: 4, 5, 8, 10, 12, 20, 30, 60 seconds. You can select suitable stage classification for your purpose from pre-assigned stages (Wake, REM, NREM, Light, Deep, etc.) and up to three un-assigned stages.
You can indicate epochs which contain artifacts as artifact stages automatically or manually. Artifact stages are excluded from the calculation of average FFT, which represents sleep quality, while they are counted for the Stage Graph and the Vigilance State Parameters, which represent sleep quantity. An asterisk is displayed above the stage name if the epoch is indicated as an artifact stage.
The stage scoring result is displayed as the Hypnogram. In addition, various sorts of information can be displayed as Trend Graphs on the same time scale as the Hypnogram. The sorts of Trend Graphs are as follows;
Hypnogram
Trend Graph
You can print the Hypnogram and Trend Graphs as well as save it as a text file or a bitmap file.
SleepSign calculates the total duration or percentage of each sleep/wake stage by any time bin and time range, and draws the Stage Graph.
You can print the Stage graph as well as save it as a text file or a bitmap file.
SleepSign displays a time series list of each episode (a series of sleep/wake stages) along with duration of each episode. In addition, frequency, mean duration, and standard deviation of each episode are displayed. You can calculate and display Vigilance State Parameters by any time bin and time range (ex: light period vs. dark period, or every 6 hours). With this function, you can grasp the transition of sleep/wake patterns easily.
You can save the Vigilance State parameters result in a text file.
You can also obtain the frequency of each episode sorted by duration.
SleepSign calculates average FFT spectrums of each sleep/wake stage by each time bin and time range. The result can be saved as a text file. The average FFT spectrum is referred to as an index of sleep quality by comparing them by units or different periods of time (ex: light period vs. dark period, sleep deprived vs. control).
Average FFT of NREM and REM in light period and dark period
SleepSign can import following digital data directly.
*There are also other file formats that can be imported. Text files may need to be processed before importing. Please contact us.
SleepSign data acquisition program and related hardware enable you to acquire data from analog output of your amplifier and store as digital data in a PC. A PC and an amplifier are not included to this system.
Long videos can be synchronized and played back. Videos can be recorded with our recording software (VitalRecorder).
You can record up to four video inputs by applying a multiplexer.
Video Playback