


Analysis
- TOP>
- Analysis
SleepSign
SleepSign drastically reduces the time and labor you spend on stage scoring with its Auto-Scoring function and many other useful functions to assist your manual (visual) scoring. In addition, SleepSign enables you to generate various types of reports which are required as standard in the basic sleep research field rapidly. These report functions enable you to grasp sleep quality and sleep quantity very easily.
Feature
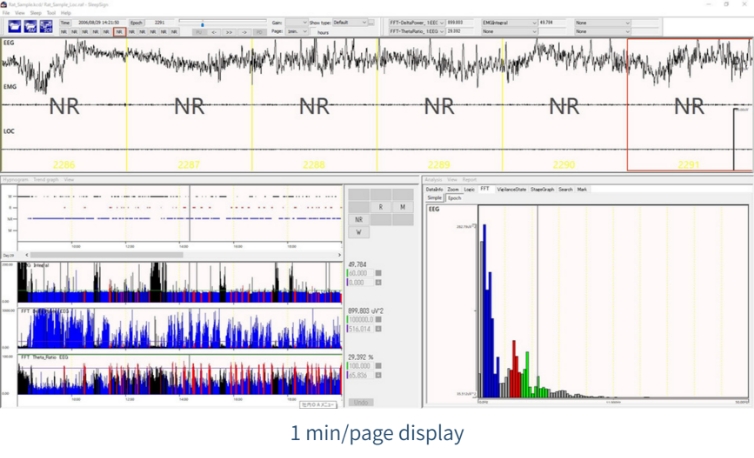
- Automatic sleep stage scoring using EEG and EMG
- Capable of analyzing not only analog signals but also European Data Format (EDF) recorded with other manufacturers’ equipment
(Data recording system available here) - All screening logic can be freely customized
- Comprehensive analytical functions include trend analysis, episode analysis, and frequency analysis
- Simultaneous video playback function
- FFT multi-screening function
- Data Summary functions (optional)
- Extensively cited in numerous research publications
Analysis
Procedure
Data Acquisition&Import
(EEG/EMG)
- Acquire data using either of the following methods, and import:
- Acquire analog signals using SleepSign-Rec(.kcd)
OR
- Digital data acquired with other digital amplifiers(.EDF)
Adjust waveform
display setting
- Time scale and gain settings
- Display channel selection
- Digital filter configuration
Auto Scoring
- Epoch time and FFT parameter settings
- Screening execution
- Threshold adjustment
Visual Scoring
- Visual scoring
- Video playback synchronized with biological signals
Data Analysis
- Trend data
- Episode analysis
- Episode analysis (multi-subject aggregation (optional))
- Frequency analysis
Analysis Function
Hypnogram /
Trend Graph
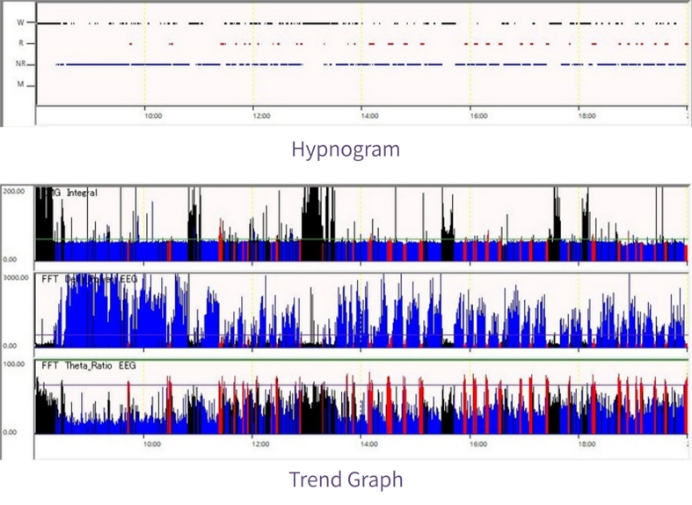
The stage scoring result is displayed as the Hypnogram. In addition, various sorts of information can be displayed as Trend Graphs on the same time scale as the Hypnogram.
The sorts of Tend Graphs are as follows;
- FFT analysis result
Percentage or frequency of a prticular waveform (such as Delta, Theta, Spindle) per epoch.
- EMG integral
Maximum or mnimum value in an epoch (useful for plotting parameters such as temperature, blood pressure).
Many other parameters
Hypnograms and trend graphs can be saved as text files or bitmap files, as well as printed.
Stage Graph
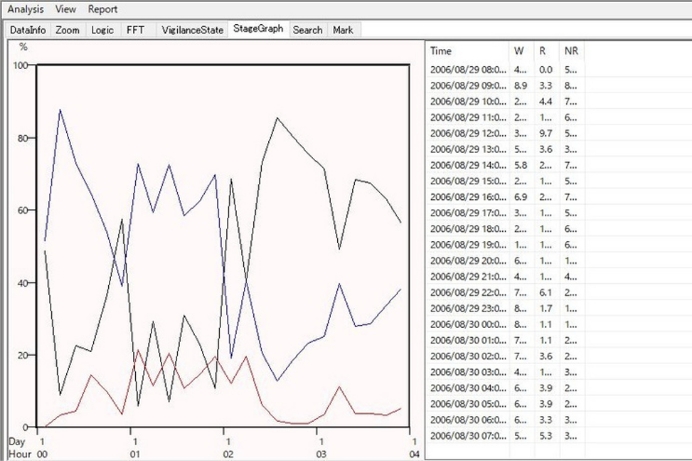
SleepSign calculates the total duration or percentage of each sleep/wake stage by any time bin and time range, and draws the Stage Graph.
Stage graphs can not only be printed but also saved as text files or bitmap files.
Vigilance State Parameters
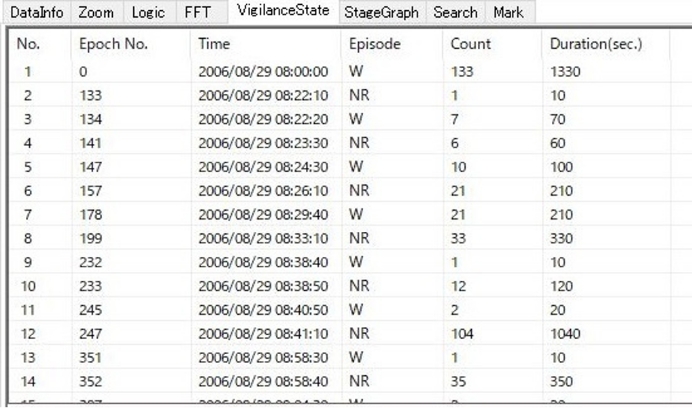
SleepSign displays a time series list of each episode (a series of sleep/wake stages) along with duration of each episode. In addition, frequency, mean duration, and standard deviation of each episode are displayed. You can calculate and display Vigilance State Parameters by any time bin and time range (ex: light period vs. dark period, every 6 hours etc…). With this function, you can grasp the transition of sleep/wake patterns easily.
Vigilance state parameter results can be saved to a text file.
Additionally, the frequency of each episode can be obtained sorted by duration.
Average FFT
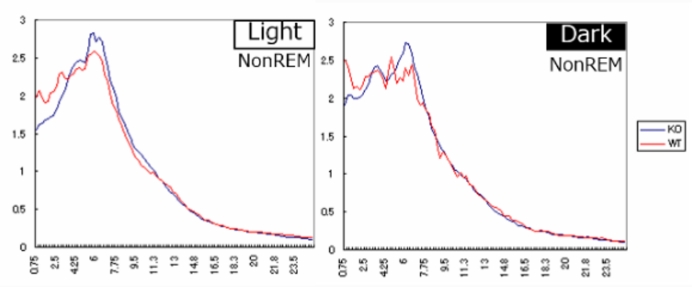
SleepSign calculates average FFT spectrums of each sleep/wake stage by each time bin and time range. The result can be saved as a text file. The average FFT spectrum is referred to as an index of sleep quality by comparing them by units or different periods of time (ex: light period vs. dark period, sleep deprived vs. control).
Option
Summary Option is a tool that automatically aggregates sleep quantity (stage duration) and quality (episode count and duration) from SleepSign analysis result (*.raf) and exports the data in Excel format.
It calculates mean values and standard deviations across multiple animals, making it useful for identifying group trends.
Summary Option comprises the following two options:
SG summary :
Stage Graph summary tool
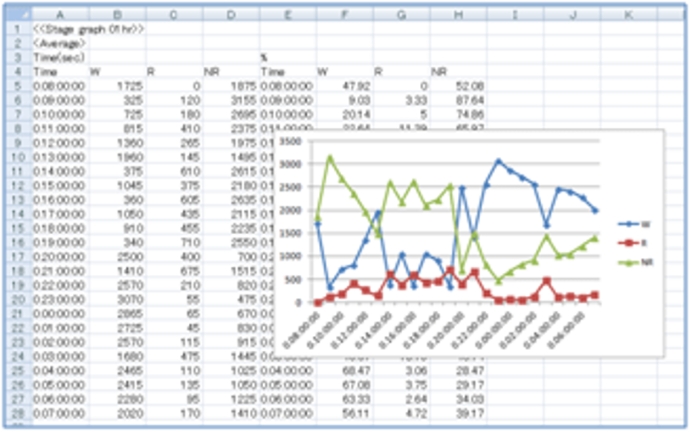
SG summary is a tool for aggregating stage appearance time.
It calculates the average and standard deviation of appearance time for each sleep stage from the analysis results of multiple subjects.
VS summary : Vigilance State summary tool
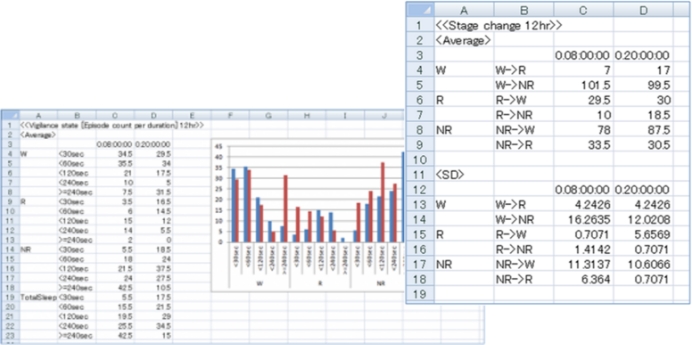
VS summary is a tool for aggregating the number of stage transitions and the duration of each stage.
Mean and SD of Stage transition counts
Stage transition count refers to the count of how many times the sleep stage changed.
This function that counts the number of times stages transitioned, such as “Wake→NREM” or “REM→Wake.”
Mean and SD of “Episode count per duration” aggregated values
This function that counts and aggregates how long each sleep stage persisted.
It also has a function to set valid episode length for eliminating short episodes.
Specifications
| Third-party digital files | European Data Format (.EDF) |
|---|---|
| SleepStages | Besides NREM, REM, and Wake, you can set up to 10 custom stage names |
| Epoch Time | 4, 5, 8, 10, 12, 15, 20, 30, 60 sec |
| Screening |
|
| Trend Analysis |
|
| Episode Analysis | StageGraph function, Vigilance State function, Stage transition count |
| Frequency Analysis | Average FFT function, Continuous FFT function, Number of bands: up to 6, Bandwidth: adjustable |
| OS |
|
